Process capability problems and solutions to those issues is very important for an organization. Another way to state this need is resolving the process capability index issues of Cp, Cpk, Pp, and Ppk is essential so that organizations will take appropriate actions from their process capability reporting.
The solution to this problem is easily accomplished with the 30,000-foot-level reporting in the Integrated Enterprise Excellence (IEE) system.
The described process capability Cp, Cpk, Pp, Ppk issues and resolution approach to process performance reporting provides improved process understanding.
Process Capability Index Cpk calculation (and other indices) Problems and Solutions
Note: Content of this webpage is from Chapters 11 and 12 of Integrated Enterprise Excellence Volume III – Improvement Project Execution: A Management and Black Belt Guide for Going Beyond Lean Six Sigma and the Balanced Scorecard, Forrest W. Breyfogle III.
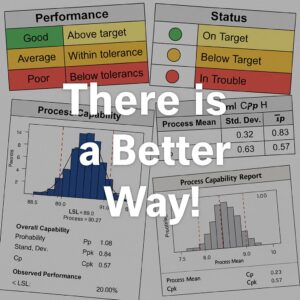
Process capability index or process performance relative to customer desires can be reported using process capability indices (e.g., Cp, Cpk, Pp, Ppk). Other approaches to describe how a process is performing includes a bar chart, pie chart, red-yellow-green scorecards (or stoplight scorecards), and a table of numbers. For a given process, each of these reporting methods can provide a very different, and somewhat subjective, picture of how a process is performing and whether any actions should be taken or not.1
In addition, these reports describe historically what happened, which may not be representative of the future. What is really desired is a futuristic statement about what is expected from the current process state so that appropriate adjustments can be made if what is “seen out the windshield” is undesirable.
Metric reporting should lead to the most appropriate action or non-action; however, often process-metric decisions are a function of how an individual or a group chose its process sampling, data analysis, and reporting procedures. From a conceptual Measurement Systems Analysis (MSA) point of view, the reporting of process performance should be independent of the person who is doing the sampling and reporting. What would be desirable is a predictive system where the only difference between individual-process reporting, in a particular time frame, would be from chance sampling variability.
In the next section of this paper, I will elaborate more on the magnitude of the issue with focus given to illustrating how Cp, Cpk, Pp and Ppk process capability index reported results can be sensitive to how a given process is sampled; i.e., a conceptual MSA issue. A predictive metric reporting system will then be described for overcoming not only the issues with process capability indices reporting but business-performance scorecards in general.
Organizations can benefit when managers utilize the described predictive measurement reporting system throughout their business functional process map.2 Practitioners can enhance the understanding of the benefits of this system when providing illustrative report-outs that compare current scorecard metric reporting to this predictive-performance metric reporting system; i.e., process capability problems and solutions resolution.
Process Capability Index (Cp, Cpk, Pp and Ppk) Issues and Resolution
The process capability index Cp represents the allowable tolerance interval spread in relation to the actual spread of the data when the data follow a normal distribution. This equation is

where USL and LSL are the upper specification limit and lower specification limit, respectively, and the spread of the distribution is described as six times standard deviation; i.e., 6σ.
Cp addresses only the spread of the process; Cpk is used to address the spread and mean (μ) shift of the process concurrently. Mathematically, (i.e., Cpk process capability index cpk calculation) can be represented as the minimum value of the two quantities

The process capability index of Pp and Ppk are sometimes referred to as long-term capability or performance indices. The relationship between Pp and Ppk is similar to that between Cp and Cpk. The index Pp represents the allowable tolerance spread relative to the actual spread of the data when the data follow a normal distribution. This equation is

where USL and LSL are the upper specification limit and lower specification limit. No quantification for data centering is described within this Pp relationship.
Mathematically, Ppk can be represented as the minimum value of the two quantities
![]()
Let’s consider the confusion encountered with regard to the calculation of the seemingly simple statistic, standard deviation. Although standard deviation is an integral part of the calculation of process capability, it seems to me that the method used to calculate the value is rarely adequately scrutinized.
In some cases, it is impossible to get a specific desired result if data are not collected in the appropriate fashion. Consider the following three sources of continuous data:
- Situation 1. An
 and R control chart with subgroups of sample size of 5.
 - Situation 2. An X chart with individual measurements.
- Situation 3. A random sample of measurements from a population.
For these three situations, Cp, Cpk, Pp and Ppk, a standard deviation estimate ( ) is determined through the relationships shown in Table 1:

* Statistical computer programs will sometimes pool standard deviations for un-biasing reasons when there are m subgroups of sample size n, resulting in a slightly different value for standard deviation.
Table 1: Cp, Cpk, Pp and Ppk relationships
In this Table,  is the overall sample mean, xi is an individual sample (i) from a total sample size N,
  is the mean subgroup range,
  is the mean range between adjacent subgroups, N is the total sample size, and d2 is a factor for constructing variables control charts; e.g., d2 equals 1.128 for a two-observation sample and 2.326 for a five-operation sample.
The following example data set will be used to illustrate the impact that different data collection techniques can have on reported process capability metrics.

Table 2: Process Time-series Data
When reporting process capability index, it is important that the data from which the metric is calculated is from a stable process; i.e., the process is in control. These data were used in another article X-bar and R Control Chart: Issues and Resolution to compare traditional and R process stability assessment to high-level 30,000-foot-level operational-metric reporting.
In this x-bar and R control chart article, a traditional control chart indicated that the process was out of control, while 30,000-foot-level reporting indicated that the process was in control. Described in this article were the advantages of a 30,000-foot-level assessment when compared to traditional reporting. The following discussion will presume that the process is considered stable.
To quantify the capability of this process, someone could have chosen to select only one sample instead of five for each subgroup. These two scenarios would result in the following standard deviation calculations:

 (Consider that sample one in the above table was the individual reading for each subgroup)

For a specification of 95 – 105, a statistical analysis program used similar standard deviations when determining the process capability results, as shown in Figure 1 and 2.

Figure 1: Process Capability for Five-sample subgroup

Figure 2: Process Capability for One-sample subgroup
Table 3 summaries the process capability results shown in Figure 1 and 2.

Table 3: Summary of Cp, Cpk, Pp and Ppk Values from the Analyses
From this table, we note a large difference between the Cp and Cpk values for a subgrouping sample size of one sample versus five. An examination of the standard deviation equations provides the reason for the large difference between the two sampling plans. The reason for this disparity is that Cp and Cpk calculations, which used an and R chart, had their equation’s standard deviation determined by averaging within subgroups, while for the individuals chart, standard deviation was calculated between subgroups.
With a good conceptual Measurement System Analysis (MSA) system, process sampling plans should have no effect on process performance statements. Because of the differences noted above, we can conclude, in general, that process capability reporting can have MSA issues since a sample of five versus one did not provide similar answers; i.e., differences being only the result of luck-of-the-draw sampling.
One might note that, in this analysis, Pp and Ppk are similar for the two sampling procedures. However, as was shown in X-bar and R Control Chart: Issues and Resolution, an and R control chart analysis would indicate that the process was out of control; hence, a process capability analysis would not be appropriate for this form of control-charting analysis. This reference also notes technical reasons why individuals control charting is preferred over and R control charting.
Other conceptual MSA issues with process capability indices reporting include:
- If data are not normally distributed, the above equations are not valid.
- The physical implication of reported process capability indices is uncertain and possibly wrong.
- Without an accompanying statement of process stability, from a control chart, all process capability indices are of a questionable value. Any process capability assessment of an unstable process is improper and often deceptive.
- Process capability indices do not provide a predictive performance statement.
Next will be described is a predictive performance metric reporting methodology that addresses these issues.
Process Capability Index Problems and Solutions: Predictive Performance Metric Reporting Alternative to Process Capability Index Cpk Calculation Reporting of Cp, Cpk, Pp, and Ppk
From a conceptual MSA point of view, there are three questions that should be addressed during statistical business performance charting (SBPC), or 30,000-foot-level2 tracking, and reporting for both transactional and manufacturing process outputs. These questions are:
- Is the process unstable or did something out of the ordinary occur, which requires action or no action?
- Is the process stable and meeting internal and external customer needs? If so, no action is required.
- Is the process stable but does not meet internal and external customer needs? If so, process improvement efforts are needed.
Process performance reporting using process capability indices, bar charts, pie charts, red-yellow-green scorecards, or a table of numbers can provide very differing process performance assessments, a conceptual MSA issue, and, in addition, does not structurally address the three-described action options.2
The following illustrates a system for describing a process output performance from a high-level airplane-in-flight view or a 30,000-foot-level. For this SBPC reporting, an individuals control chart subgrouping frequency is made so that typical variability from input variables occurs between subgroups.
Data from regions of stability can be used to estimate the non-conformance rate of a process during those timeframes. If there is a recent region of stability, data from this region can be considered a random sample of the future, from which a prediction statement can be made. This prediction statement presumes that no fundamental positive or negative changes will occur in the future, relative to the process inputs or its execution steps.
If, at some point in time, the output of a stable process is performing at an undesirable non-conformance level, an organization can initiate an improvement project (e.g., Lean Six Sigma project) with the intent to change process inputs or steps to improve a process performance level.
For continuous data, a probability plot can provide an estimate of the process non-conformance rate in either percentage or dpmo (defect per million opportunity) units. For attribute data, the process-estimated non-conformance rate is simply the overall combined subgroup failure rates in the region of process stability.
Figure 3 illustrates the 30,000-foot-level charting of the data shown in Table 1. It is important to note how the estimated non-compliance rate of 26.852% reported in
Figure 3 is similar to the PPM total rate of 268525.98 reported in Figure 1.

Figure 3: 30,000-foot-level Chart of Data from Table 13
Summary: Process Capability Problems and Solutions: Process Capability Index Cp, Cpk, Pp, Ppk Have Issues which are Resolved
When reporting how a process is performing using capability indices (Cp, Cpk, Pp, Ppk), the magnitude of the reported metrics for a given situation can be a function of sampling procedures. For example, different conclusions could be made when process data are analyzed from an individuals chart report-out (one sample per subgroup) versus a and R chart reporting (multiple samples per subgroup); i.e., a conceptual process performance MSA issue.
Traditional organizational performance measurement reporting systems can utilize a table of numbers, stacked bar charts, pie charts, and red-yellow-green-goal-based scorecards. For a given situation, one person may choose one reporting scheme, while another uses a completely different approach. These differences can lead to a different conclusion about what is happening and should be done.
In addition, the described traditional reporting methods provide only an assessment of historical data and make no predictive statements. Using this form of metric reporting to run a business is not unlike driving a car by only looking at the rearview mirror, a dangerous practice.
When a predictive 30,000-foot-level charting system is used to track interconnected business process map functions, an alternative forward-looking dashboard performance-reporting system becomes available. With this 30,000-foot-level metric system, organizations can systematically evaluate future expected performance and make appropriate adjustments if they don’t like what they see, not unlike looking out a car’s windshield and turning the steering wheel or applying the brake when adjustments are needed.
30,000-foot-level reporting addresses traditional process capability problems and provides the solutions to the issues.
Enhancement of KPI and Performance Metrics Reports: 30,000-foot-level reporting
Key Performance Indicator (KPI) and Performance Metrics Reporting benefits when these reports use a 30,000-foot-level format described in “KPI and Performance Metrics Reporting 2.0.”

A Free Software App for Creating 30,000-foot-level charts
Business Benefiting from Application of 30,000-foot-level Predictive Performance Metric Reporting
Organizations benefit when 30,000-foot-level techniques are integrated within a business system that analytically/innovatively determines strategies with the alignment of improvement projects that positively impact the overall business. Integrated Enterprise Excellence (IEE) provides a system for this integration.
Businesses experience improvements in the financials when they incorporate measurement reporting that dashboards and scorecards that lead the most appropriate behaviors. Traditional dashboards and scorecards can be transitioned to 30,000-foot-level predictive performance metric reporting, as illustrated in the eight illustrations which are available through the article Predictive Performance Dashboard Scorecard Reporting.
An IEE business management system in an organization addresses the traditional business scorecard and improvement issues that are described in a one-minute video:

The details of implementing the IEE system and its process capability analysis metrics throughout organizations is described in a 2-book, novel written series:
Books (Audio, Paperback, and E-book) Amazon Availability
- Management 2.0: Discovery of Integrated Enterprise Excellence (Management and Leadership System 2.0 Book 1)
- Leadership System 2.0: Implementing Integrated Enterprise Excellence (Management and Leadership System 2.0 Book 2)
References
- Forrest W. Breyfogle III, Integrated Enterprise Excellence Volume III – Improvement Project Execution: A Management and Black Belt Guide for Going Beyond Lean Six Sigma and the Balanced Scorecard, Bridgeway Books/Citius Publishing, 2008
- Forrest W. Breyfogle III, Integrated Enterprise Excellence Volume II – Business Deployment: A Leaders’ Guide for Going Beyond Lean Six Sigma and the Balanced Scorecard, Bridgeway Books/Citius Publishing, 2008
- Figure created using Enterprise Performance Reporting System (EPRS) Software
Application of IEE and 30,000-foot-level Reporting to Creation of a Long-lasting Business Process Management (BPM) and Management Information System (MIS) Implementation
How to benefit from the IEE system in operations management with its Enterprise Performance Reporting System (EPRS) software (which provides predictive scorecard reporting and a process improvement system so the big picture benefits) is described in:
- How to Avoid Commonplace Business Management System Software Problems
- How to Avoid Commonplace Management Information System Software Problems
- How to Avoid Commonplace Business Process Management Software Problems
- How to Avoid Commonplace Lean Six Sigma Problems
Next Steps
Schedule a video meeting with Forrest to see how your organization could benefit from the IEE system and 30,000-foot-level reporting using one of your datasets.
If you do not see a suitable time in the Schedule a Meeting link below, email Forrest at forrest.breyfogle@smartersolutions.com.