This predictive analytics models example non-normal data illustrates the benefits of 30,000-foot-level performance reporting in an Integrated Enterprise Excellence (IEE) Business Management System.
This “30,000-foot-level Charting: Non-normal Data” discussion addresses process stability and predictability of a non-normal data output response over time.
Predictive Analytics Models Example Non-normal Data: 30,000-foot-level Charting
Content of this article is from Chapter 12 of Integrated Enterprise Excellence Volume III – Improvement Project Execution: A Management and Black Belt Guide for Going Beyond Lean Six Sigma and the Balanced Scorecard, Forrest W. Breyfogle III.
When non-normally distributed data are tracked over time at the 30,000-foot-level,1 process stability is to be assessed and a predictive statement provided, when appropriate. However, to make these assessments, a transformation that makes physical sense for this assessment may be needed.
The need for this transformation consideration is described in the article Transforming Individuals Control Chart Data and its Importance.
To illustrate the application of creating a 30,000-foot-level chart that has a transformation, 1000 data values were generated from a non-normal distribution. The process from which these data set samples were to have been taken was to have an upper specification limit 0.035 inches for the flatness of the produced part. The same basic approach could be used for a transactional time-to-deliver assessment, where a response cannot physically be below 0 time.
Figure 1 shows a 30,000-foot-level chart of these data and their performance relative to a specification level of 0.035 that was not to exceed by more than 1% of the produced products.
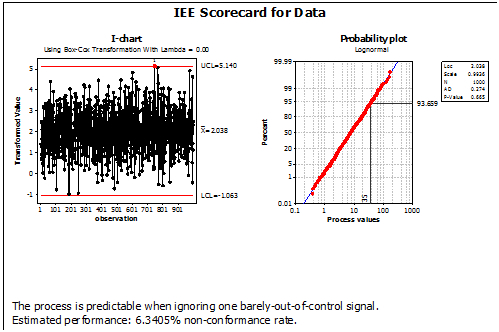
Figure 1: 30,000-foot-level Chart with an upper Specification of 0.035 inches2
With this 30,000-foot-level analysis approach, it was demonstrated from the individuals control chart in the left corner of the report-out that the process was currently stable; hence, a process prediction statement could be made. The probability plot on the right side of the graph describes the variability of the continuous-response process with its demonstrated predictability statement. With 30,000-foot-level reporting, a statement at the bottom of the plot nets out how the process is performing relative to the specification requirement of 0.035; i.e., a predictable process with an approximate non-conformance rate of 6.3 percent.
A Lean Six Sigma improvement project could be used to determine what should be done differently in the process so that the 0.035 inch upper specification requirement is met. Upon satisfactory completion of an improvement project, the 30,000-foot-level control chart would need to shift to a new level of stability that had a process performance metric, which is satisfactory relative to a customer 1 percent maximum nonconformance criterion.
Summary for Predictive Analytics Models Example Non-normal Data with 30,000-foot-level Charting
This article described the use of an appropriate transformation from a physical point of view when deciding which actions or non-actions are most appropriate:
- Is the process unstable or did something out of the ordinary occur, which requires action or no action?
- Is the process stable and meeting internal and external customer needs? If so, no action is required.
- Is the process stable but does not meet internal and external customer needs? If so, process improvement efforts are needed.
The box at the bottom of Figure 1 describes the state of the examined process in terms that everyone can understand; i.e., the process is predictable with an estimate 6.3-percent nonconformance rate.
An organization gains much when this form of scorecard-value-chain reporting is used throughout its enterprise and is part of its decision-making process and improvement project selection.
Predictive Analytics Models Example Non-normal Data Applications
The described 30,000-foot-level charting technique has many applications, as described in 30,000-foot-level Performance Reporting Applications.
How IEE 30,000-foot-level predictive analytics models in the IEE system address traditional business scorecard and improvement issues is described in a 1-minute video:

References
- Forrest W. Breyfogle III, Integrated Enterprise Excellence Volume III – Improvement Project Execution: A Management and Black Belt Guide for Going Beyond Lean Six Sigma and the Balanced Scorecard, Bridgeway Books/Citius Publishing, 2008
- Figure created using Enterprise Performance Reporting System (EPRS) Software
Contact Us to set up a time to discuss with Forrest Breyfogle how your organization might gain much from an Integrated Enterprise Excellence (IEE) approach for predictive analytics models.