How to improve KPI reporting is one of the most pressing questions faced by leadership teams in today’s data-saturated business environment.
Organizations track more data than ever before, but most continue to struggle with converting their metrics into meaningful guidance that drives the business forward.
Dashboards update daily, scorecards are reviewed in meetings, and yet the performance needle often does not move.
Leaders still end up making decisions based on intuition rather than evidence — and frontline employees often cannot see how their daily activities connect to the overarching strategy.
This issue does not stem from a lack of KPIs, but rather from having the wrong KPI reporting system — one that measures “activity” instead of “impact“, and one that highlights problems but does not guide how to solve them.
The traditional approach frequently results in firefighting, short-term reactions, and internal debates about interpretation rather than focused improvement.
This page provides a structured, strategic answer to how to improve KPI reporting: by implementing a system that moves beyond dashboards and red-yellow-green scorecards and instead produces predictive, actionable performance insights that link operational processes to bottom-line financial results.
The approach described here is grounded in the Integrated Enterprise Excellence (IEE) methodology from Smarter Solutions, Inc., which was founded in 1992 and has helped organizations across industries achieve a culture of proactive improvement and aligned decision-making.
How to Create Key Performance Indicators
Understanding how to create key performance indicators begins with recognizing that KPIs should not be selected based on convenience, familiarity, or legacy practices.
Too often, organizations choose KPIs that are easy to count, but do not reflect the processes that genuinely drive business performance.
To improve KPI reporting meaningfully, KPIs must be connected to the processes that create them and structured to lead predictive understanding, not simply reflection of what has already occurred.
The question of how to create key performance indicators is fundamentally about alignment: aligning strategy, operations, performance measurement, accountability, and improvement activities. This is where the Integrated Enterprise Excellence (IEE) methodology offers substantial value.
IEE provides a system that links all KPIs to business objectives and improvement priorities in a clear, traceable manner — ensuring that when a KPI results indicate an undesirable trend or prediction, the organization knows exactly where and how to intervene.
The webpage “Operational Key Performance Indicators 2.0: A Smarter KPI Reporting System” explains how KPIs can be framed as part of an enterprise-wide performance measurement architecture rather than as isolated metrics.
Similarly, “Key Performance Indicators Reporting 2.0” outlines how to design measures that create visibility into cause-and-effect relationships, allowing organizations to take informed and effective action.
Developing Key Performance Indicators
When developing key performance indicators, one of the most important considerations is how the results are communicated.
Many organizations rely on scorecards that use colors (red-yellow-green) or tables full of numbers. These formats do not show whether performance is stable, improving, or degrading, nor do they tell whether external interventions would lead to meaningful improvement.
The Integrated Enterprise Excellence (IEE) approach replaces these ambiguous reporting styles with “30,000-foot-level metrics“. These metrics transform raw data into a statistically-based view that distinguishes random variation from meaningful process change.
A 30,000-foot-level metric can generate a predictive statement about future process performance.
This moves KPI reporting from reactive to proactive — from “What happened last month?” to “What level of performance should we expect next month if nothing changes?”
This application allows organizations to create statistically valid KPI charts that clearly communicate whether performance is stable or signals the need for process improvement.
When such predictive KPIs indicate that future performance will continue to be undesirable, it triggers a structured need to improve the underlying business process.
The video “Metric Reports that Lead to the Best Behaviors” explains how predictive KPIs shift organizational culture away from firefighting and toward data-driven, strategic improvement.

Illustration of the transision of a red-yellow-green scorecard to a 30,000-foot-level predictive scorecard report is shown in the following figure.
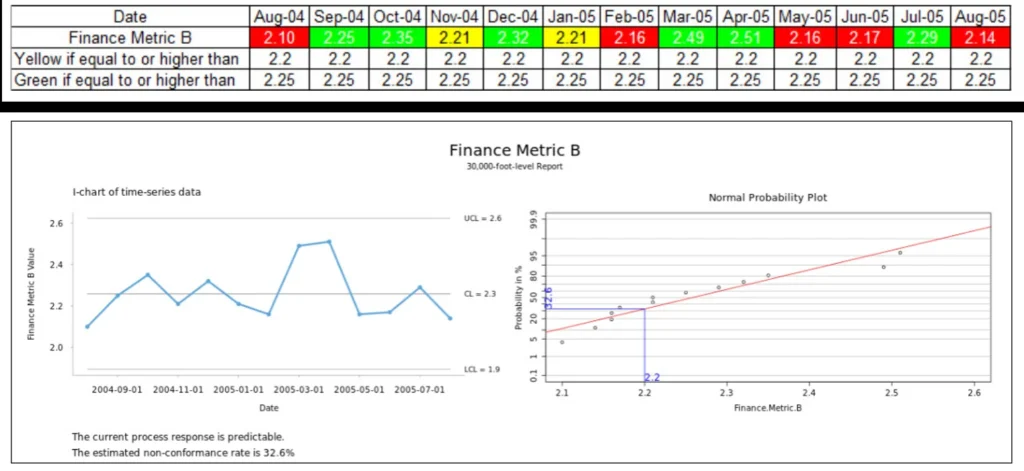
In the red-yellow-green (top figure), someone is to take action when there is a red-color metric.
However, in the bottom figure (a 30,000-foot-lever report), the left individuals chart for the same dataset indicates tht the process is stable.
The right probability plot in this figure indicates that one can expect to continue to have about 32.6 % of the time to be below 2.2, the red-color transition specification.
This expected level of performance is reported at the bottom of the 30,000-foot-level report.
If this level of performance is unsatisfactory, there is a need for process improvement.If a process improveent effort were significant for this metric, the individuls chart would show a staging where the enhanced metric non-conformance rate would be shown at the bottom of the report.
How to Write a Key Performance Indicator
Understanding how to write a key performance indicator requires clarity in both the definition of the measure and the system that maintains and interprets it.
Beyond defining a KPI, organizations must ensure that the KPI can be tracked consistently and interpreted accurately.
When KPI reporting is deployed using the Enterprise Performance Reporting System (EPRS), predictive 30,000-foot-level metrics can be updated automatically and shared throughout the organization. This creates a unified and consistent view of reality, eliminating arguments about interpretation or data source ownership.
This level of clarity also enables significantly more effective use of Artificial Intelligence (AI). Most organizations try to apply AI to systems that are filled with non-predictive historical data and unclear performance relationships.
With IEE and EPRS, KPIs are linked directly to the processes that generate them — the “Y = f(X)” cause-and-effect relationship.
If an output KPI (Y) is predicted to remain at an undesirable level, the organization now has a clear directive: improve the input processes (Xs).
This approach makes process improvement purposeful, actionable, and aligned with financial goals.
Books on Key Performance Indicators
Several books provide a strategic foundation for improving KPI reporting and building a culture of data-driven, enterprise-aligned decision-making.
Two central works that expand on these principles are:

Business Management 2.0
This book explains in a novel-written format how to transition from a reactive performance culture to a system-driven enterprise that makes improvements based on predictive measurements. It demonstrates how organizations can design performance systems that minimize firefighting, reduce variation in decision-making, and align improvement projects with financial impact.
Leadership System 2.0
This book continues the story from Business Management 2.0 providing leadership teams with the structure needed to guide improvement priorities across the enterprise, ensuring that organizational effort is coordinated and measurable. It describes how leaders can construct management systems that reinforce accountability, alignment, and sustained business excellence.
Both books support organizations seeking to build an effective KPI reporting methodology that focuses on strategic improvement, enhances transparency, and improves the bottom line.
How to Improve KPI Reporting: Bringing It All Together
Smarter Solutions, Inc. , founded in 1992, brings decades of experience in answering the question of how to improve KPI reporting in a methodical, meaningful way.
The Integrated Enterprise Excellence (IEE) system turns KPI reporting into a powerful mechanism for achieving the “Three Rs of Business”:
- Doing the Right things
- Doing them Right
- And doing them at the Right time
When KPI reporting is structured and predictive, organizations can confidently align improvement activities with financial outcomes, ensuring that every employee and team works toward common and measurable objectives.
Let’s have a discussion to see how you and your organization could benefit from predictive scorecarding!