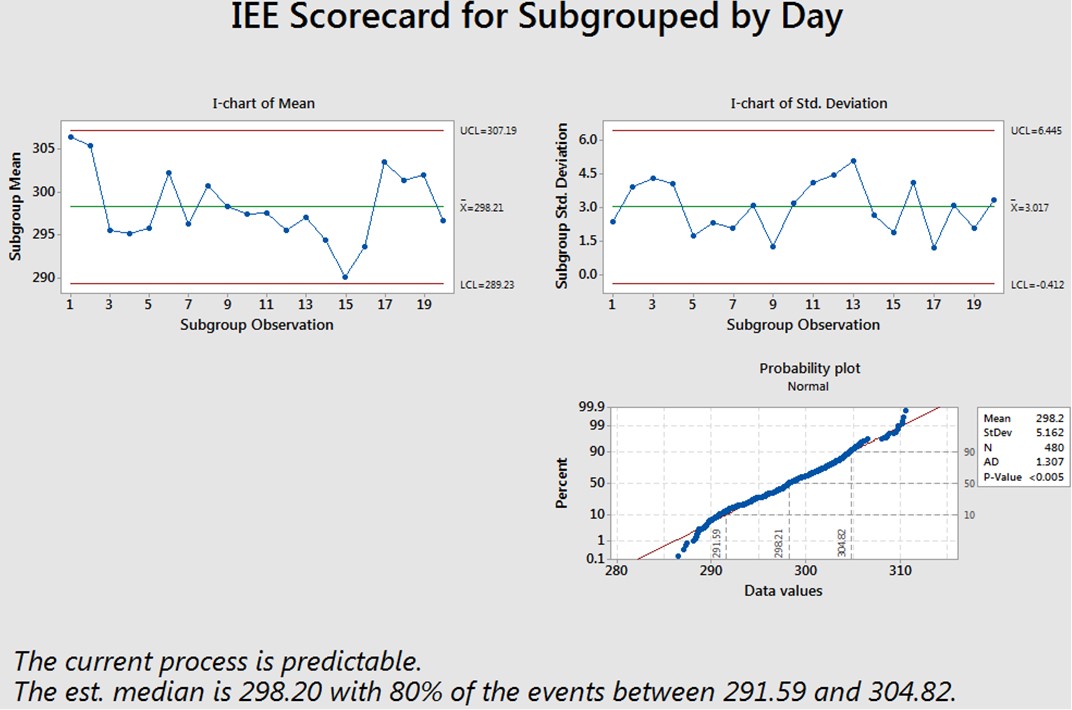
An enhanced xbar and r chart with process capability statement is available through Integrated Enterprise Excellence (IEE) business management system 30,000-foot-level metric reports.
Enhanced xbar and r chart with Process Capability Statement
Traditional xbar and r charts can create false “special cause” signals that are actual from common-cause variability. This can lead to much organizational firefighting. What is needed is a reporting system that encourages fire prevention through improving processes that have a common-cause response that is undesirable.
An IEE methodology provides a 30,000-foot-level reporting methodology that addresses this issue. For a mathematical explanation of x-bar and r chart issues and 30,000-foot-level reporting resolution, click here.
With 30,000-foot-level metric reporting, time-series data that have multiple subgroup continuous-response samples can be monitored over time for stability and then, when a process is stable, provide a prediction statement at the bottom of chart, even when no specification exists.
The 30,000-foot-level methodology in an IEE business management system can be used throughout an organization with metric linkage to the processes that created them via an IEE value chain.

In an IEE value chain, processes are shown as rectangular boxes, while metrics have oblong representations. With Enterprise Performance Reporting System (EPRS) software, 30,000-foot-level metrics can be automatically updated.
An IEE system addresses the organizational performance metric reporting and improvement issues described in a 1-minute video:

The link below provides more information on 30,000-foot-level reporting as an alternative to xbar and r charts.
Contact Us to set up a time to discuss with Forrest Breyfogle how your organization could gain much from an IEE conversion of x-bar and R charting to 30,000-foot-level report outs.