An enhanced control chart for count data is available through an Integrated Enterprise Excellence (IEE) predictive performance 30,000-foot-level report out.
Control limits for a c chart in a statistical process control (SPC) methodology are to typically suggested to control processes that have count data. C chart control limits are based on the Poisson distribution. However, if a process has common-cause between subgroup variability, false out of control signals can occur with a c chart and/or untimely information can be presented that is not actionable.
ASQ Quality Progress published article titled “Control Charting at the 30,000-foot-level, Part 3” by Forrest Breyfogle addresses c chart statistical process control (SPC) issues and resolution. This article also describes the creation of a process capability index statement that is easy for others to understand.
The PDF document below describes technical problems with the c-chart and provides an alternative. Statistical Process Control (SPC) has a primary purpose of identifying when special cause conditions occur for timely corrective actions.
Enhanced Control Chart for Count Data: C chart Issues and Resolution
SPC textbooks and training state that a c-chart should be used for tracking the number of occurrences of an incident over time.
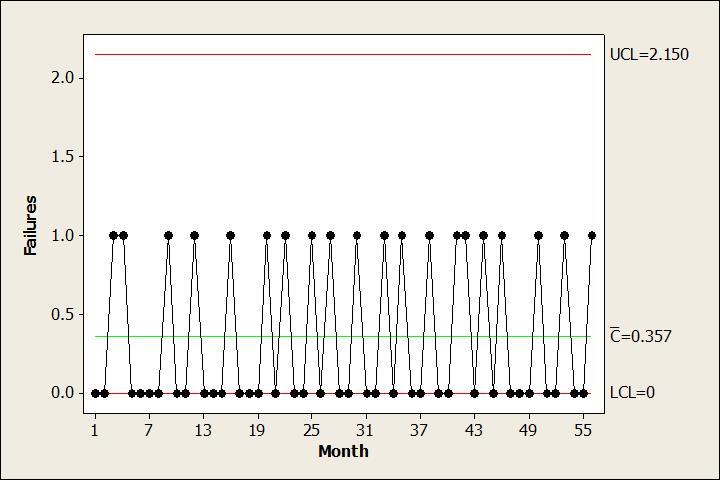
However, this approach for data tracking for determining when and what actions to undertake for a given situation can have issues. A 30,000-foot-level reporting system addresses these issues.
General information about 30,000-foot-level reporting:
- Video: 30,000-foot-level Performance Reporting Introduction (5 Minutes)
- Peer-reviewed article: 30,000-foot-level Metric Reporting
- Article: Positive Metric Performance Poor Business Performance: How Does this Happen?
A no-charge Minitab add-in is available for the easy creation of 30,000-foot-level charts
How to create 30,000-foot-level charts for a variety of performance measurement situations is described in:
- Book: Chapters 12 and 13 of Integrated Enterprise Excellence (IEE) Volume III – Improvement Project Execution: A Management and Black Belt Guide for Going Beyond Lean Six Sigma and the Balanced Scorecard
- Book: Lean Six Sigma Project Execution Guide: The Integrated Enterprise Excellence (IEE) Process Improvement Project Roadmap
- Training: Beyond Lean Six Sigma and the Balanced Scorecard
For more information about how 30,000-foot-level reporting addresses issues with c charts and count response process capability reporting, download the published PDF ASQ Quality Progress November 2005 article titled “Control Charting at the 30,000-foot-level, Part 3” article.
Contact Us to set up a time to discuss with Forrest Breyfogle how your organization might gain much from the IEE 30,000-foot-level reporting methodology.