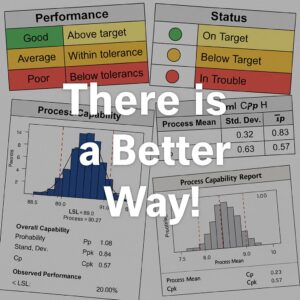
Organizations need a meaningful process capability analysis report methodology. Traditional process capability indices reports, including Cp, Cpk, Pp, and Ppk, can be confusing and deceiving.
Consider the complexity to determine standard deviation for process capability equations (shown in this blog subtitle “Understanding Key Capability Indices”) for various data sources.

Download the following published PDF article for a summary of traditional process capability and reporting issues and their resolution.
Process Capability Analysis Report
A process capability analysis report is a crucial tool for understanding how well a manufacturing or transactional process meets defined specification limits. Rather than relying on traditional red-yellow-green scorecards, a capability report quantifies actual process performance using statistical evidence. This approach enables better business decisions and targeted continuous improvement efforts.
In its simplest form, a process capability analysis compares the voice of the process (natural process variation) to the voice of the customer (specification limits). The output is a set of metrics known as capability indices, such as Cp, Cpk, Pp, and Ppk. These indices provide insight into whether a process can produce output within required specifications consistently.
Understanding Key Capability Indices
The following formulas are used in process capability analysis:
1. Cp (Process Capability Index):
This measures the potential capability of a process assuming the process mean is centered between the specification limits.
Where:
-
USL = Upper Specification Limit
-
LSL = Lower Specification Limit
-
σ = Standard deviation (estimated from within-subgroup variation)
2. Cpk (Process Capability Index – Adjusted for Centering):
Cpk evaluates how centered the process is and represents the minimum capability of the process to meet specifications.
Cpk = min( (USL – μ) / (3σ), (μ – LSL) / (3σ) )
Where:
-
μ = Process mean
-
σ = Standard deviation from within-subgroup variation
3. Pp (Performance Index):
Similar to Cp but uses overall variation (standard deviation from all data points, not just within subgroups).
Where:
-
Pp = Process Performance Index
-
USL = Upper Specification Limit
-
LSL = Lower Specification Limit
-
σ_overall = Overall standard deviation (calculated using the full data set, not just within subgroups)
4. Ppk (Performance Index – Adjusted for Centering):
This evaluates long-term process performance and accounts for both variability and centering.
Ppk = min( (USL – μ) / (3 * σ_overall), (μ – LSL) / (3 * σ_overall) )
Where:
-
Ppk = Process Performance Index (adjusted for centering)
-
USL = Upper Specification Limit
-
LSL = Lower Specification Limit
-
μ = Process mean
-
σ_overall = Overall standard deviation (calculated from the entire data set)
What to Include in a Process Capability Analysis Report
A traditional comprehensive process capability analysis report should include:
-
Process Description: Clearly define the process being analyzed, including the product or service characteristics under measurement.
-
Specification Limits: Document USL and LSL, as defined by customer or design requirements.
-
Data Collection Plan: Explain the sampling method, frequency, and measurement system used to gather the data.
-
Statistical Charts: Include a histogram and a control chart (preferably a 30,000-foot-level chart if applying Integrated Enterprise Excellence principles) that show the data’s behavior over time.
-
Summary Statistics: Report the process mean, standard deviation, and number of observations.
-
Capability Indices: Present Cp, Cpk, Pp, and Ppk values, along with interpretation.
-
Improvement Opportunities: If indices fall below acceptable thresholds (typically < 1.33 for critical processes), identify root causes and suggest improvement actions.
Why a Smarter Reporting Method Matters
Traditional capability studies often fail to reflect real-world performance because they are snapshot-based and influenced by unstable data. Smarter Solutions advocates a 30,000-foot-level reporting methodology, which evaluates stability and capability from a process-wide perspective rather than short-term samples. This method ensures that reported metrics are truly representative of the process.
A meaningful process capability analysis report doesn’t just compute values—it tells a story about process performance. When done correctly, it becomes a strategic decision-making tool rather than just another compliance checkbox.
The process capability analysis report linked-to PDF highlights issues with traditional process capability indices reporting and what can be done to resolve the problem. The Integrated Enterprise Excellence (IEE) business management system for 30,000-foot-level predictive performance reporting is the approach that is described in the article, which provides needed traditional process capability reporting enhancements.
Process capability and process performance report-outs should lead to the most appropriate action or inaction, which is independent of the person compiling the information. However, this does not often occur with traditional techniques as described in a published article (PDF below) ″Insight Or Folly? Resolve Issues With Process Capability Indices, Business Metrics″, written by Forrest Breyfogle .
Consider the different approaches someone might use to report the output of a process. One might choose a bar chart, a pie chart, a red-yellow-green scorecard, a table of numbers, or process capability indexes (that is, Cp, Cpk, Pp, Ppk, and Cpm).
For a given situation, each of these reporting methods can provide a very different, and somewhat subjective, picture of how a process performs and whether any actions should be taken or not.
Process Capability Analysis Example: Process Capability Standard Deviation Calculation
To illustrate the magnitude of the process performance and process capability reporting issue, the PDF article below will use a process capability analysis example to illustrate how reporting Cp, Cpk, Pp, and Ppk process indices values can be very sensitive to process sampling procedures – a conceptual Measurement Systems Analysis (MS) issue.
Process capability indices is basically the reporting of a customer specification need by the variability of the process, which is a multiple of the processes’ standard deviation. However, from the chart above, one can see how an inputted standard deviation value from a process control chart to this formula could differ a lot dependent upon the sampling procedure from a process (PDF article provides more details).
In addition, traditional process capability indices reporting describe historically what happened, which may not be representative of the future. What is really desired is a statement about what is expected in the future so changes can be made, if needed.
In Lean Six Sigma, much training effort is spent on conveying the importance of having a measurement system so that consistent and correct decisions are made relative to assessing part quality and process attributes. In this training, Measurement Systems Analysis (MSA) and associated Gage R&R (Repeatability and Reproducibility) studies are an integral part of this overall focus.
It would seem that conceptually MSA should be a reporting consideration for all forms of measurements, including business performance metrics. In addition, one would think that focus should be given so that metric statements are in clear understandable language. But, in the real world, how well are these attributes achieved? Often not as good as one might think. An improved methodology is described in this PDF’s Process Capability Analysis Example.
Understanding the Process Capability Equation in Smarter 30,000-Foot-Level Reporting
A process capability analysis is only as reliable as the data and methodology used to calculate it. While traditional control charts and snapshot-based metrics often mislead or oversimplify, the 30,000-foot-level reporting methodology described in Smarter Solutions’ Integrated Enterprise Excellence (IEE) system offers a fundamentally better approach. At the core of process capability analysis lies the process capability equation—a statistical formula that quantifies how well a process can meet customer specifications. But understanding how and when to use this equation is just as important as the math itself.
What is the Process Capability Equation?
The process capability equation provides a numeric index that compares a process’s natural variation to its specified performance limits. The most common version is for Cp (Process Capability Index), which assumes a centered and stable process:
Where:
-
USL = Upper Specification Limit
-
LSL = Lower Specification Limit
-
σ = Estimated standard deviation from within-subgroup variation
This equation gives a sense of whether the process could meet specifications—if it were perfectly centered. But real-world processes are rarely centered, and that’s where Cpk, an adjusted version of the process capability equation, becomes critical:
Cpk = min( (USL – μ) / (3 * σ), (μ – LSL) / (3 * σ) )
Where:
-
Cpk = Process Capability Index (accounting for centering)
-
USL = Upper Specification Limit
-
LSL = Lower Specification Limit
-
μ = Process mean
-
σ = Standard deviation (estimated from within-subgroup variation)
Here, μ represents the process mean. If the mean drifts away from the center of the specification limits, the Cpk value drops, signaling increased risk of non-conformance.
The Problem with Traditional Use of the Process Capability Equation
In traditional applications, these equations are often used inappropriately:
-
Calculations are based on unstable processes, which voids any statistical meaning.
-
Short-term data or arbitrarily selected samples distort actual long-term behavior.
-
Results are shared using misleading scorecards that don’t link metrics to business impact.
Organizations might celebrate a Cpk of 1.33 without realizing the underlying data shows instability or sporadic outliers that could harm quality.
Smarter Reporting: 30,000-Foot-Level View
Smarter Solutions’ 30,000-foot-level reporting overcomes these challenges by embedding the process capability equation into a larger context that ensures validity and actionability:
-
Stability First: Before calculating capability indices, the method determines whether the process is in a state of statistical control using time-ordered data.
-
Long-Term View: Data is not cherry-picked; instead, a holistic, chronological dataset is analyzed using a non-subjective approach.
-
Enterprise Linkage: Results are visually represented in a way that connects process metrics with high-level business goals.
The process capability equation isn’t discarded—it’s elevated. When used within the 30,000-foot-level methodology, the capability metric truly reflects a process’s performance potential and can guide focused, impactful improvement.
Final Thoughts about the Process Capability Equation
In isolation, the process capability equation provides only a partial view. But when combined with smarter analysis and a systems-thinking perspective—as described in the IEE framework—the equation becomes a powerful decision-support tool. It can identify where to focus improvement efforts, justify resource allocation, and build trust in reporting accuracy across the enterprise.
It’s time to move beyond traditional metrics and embrace a better way—where process capability equations serve as a foundation for transformation, not just a checkbox in quality audits.
Demystifying the Process Capability Ratio: A Smarter Perspective
When evaluating how well a process performs against specification limits, the term “process capability ratio” frequently comes up. But as with many performance metrics, the value of this ratio depends heavily on the method used to calculate and interpret it. In traditional Six Sigma and quality management practices, this ratio is often reported without verifying process stability, which can lead to misleading or even harmful conclusions. That’s why Smarter Solutions advocates for a more insightful, data-driven approach using 30,000-foot-level reporting.
What is the Process Capability Ratio?
The process capability ratio typically refers to the Cp index, which compares the width of the specification limits to the natural spread of process data. It is defined as:
Cp = (USL – LSL) / (6 * σ)
Where:
-
USL = Upper Specification Limit
-
LSL = Lower Specification Limit
-
σ = Standard deviation (typically based on within-subgroup variation)
This ratio gives an idea of how much room a process has to vary within the allowed limits. For example, a Cp value of 1.33 or higher is often considered acceptable in many industries. However, this assumes the process is perfectly centered between the limits and is stable over time—assumptions that are rarely validated in conventional reporting.
The Pitfalls of Traditional Capability Ratio Reporting
Too often, organizations report the process capability ratio based on short-term data that doesn’t represent actual process behavior. Snapshot samples or control charting methods that don’t verify long-term stability can lead to Cp values that look favorable on paper but don’t reflect operational reality.
For instance, a process might show a Cp of 1.50, suggesting high capability, but if the mean drifts or if there is instability in the process, this figure becomes irrelevant. Worse, relying on such flawed data can result in poor decisions, like unnecessary rework, missed improvement opportunities, or customer dissatisfaction.
Smarter Solutions’ 30,000-Foot-Level Advantage
Smarter Solutions addresses these shortcomings through its 30,000-foot-level reporting methodology, an integral part of the Integrated Enterprise Excellence (IEE) system. Instead of narrowly focused and potentially biased snapshots, this approach evaluates capability with a broad, high-level perspective that ensures credibility and relevance.
Here’s how it works:
-
Statistical Stability First: Before any capability ratio is calculated, the process is assessed for stability using time-ordered data. Only if the process is stable does the Cp value have true meaning.
-
Data Across Time: Instead of cherry-picking a subset, the entire dataset—spanning a meaningful timeline—is evaluated to account for long-term behavior.
-
Business Alignment: Capability indices are not just numbers—they are tied back to business goals and metrics, making them useful for strategic decision-making.
Moving Beyond Ratio Metrics Alone
The process capability ratio is a useful tool—but only when calculated and interpreted in context. The 30,000-foot-level methodology enhances the reliability of this ratio by ensuring data integrity and linking results to enterprise performance. This smarter way not only corrects for the shortcomings of traditional methods but also transforms capability analysis into a strategic asset for sustainable improvement.
In today’s competitive landscape, accuracy and insight are non-negotiable. Smarter Solutions provides the framework to ensure both—because there is a better way to understand and use the process capability ratio.
Rethinking the Process Capability Index with 30,000-Foot-Level Insight
The process capability index (PCI), often symbolized as Cp, Cpk, Pp, and Ppk, is traditionally used to assess how well a process performs relative to its specification limits. Yet, despite its mathematical precision, the value and accuracy of this metric often fall short when viewed in isolation or within the constraints of outdated statistical assumptions. The Integrated Enterprise Excellence (IEE) system, developed by Smarter Solutions, offers a smarter and more sustainable approach to capability reporting—known as 30,000-foot-level metrics reporting.
So, what’s the issue with the traditional process capability index reporting?
Most capability indices assume that data are normally distributed and that the process is in statistical control. These assumptions rarely hold true in real-world environments. Applying traditional process capability formulas without understanding the true nature of the data can lead to misleading conclusions and misguided business decisions. For example, a Cpk of 1.33 may seem acceptable, but if the underlying process data is unstable or non-normal, this value becomes irrelevant.
That’s where the 30,000-foot-level reporting methodology provides true operational insight. Instead of blindly calculating indices on potentially flawed data sets, this smarter method first evaluates whether a process exhibits a stable trend over time and whether a single predictive distribution can describe future performance.
The Shift from Folly to Insight
Traditional capability indices often provide a snapshot—a single moment in time—without context or trend visibility. In contrast, 30,000-foot-level metrics evaluate performance across time, aligning with business objectives and helping leadership see beyond point-in-time statistics.
Within this smarter framework, we ask:
-
Is the process stable over time?
-
Is the data from a single predictable distribution?
-
Can we estimate the future non-conformance rate directly from observed behavior?
If the answers indicate instability or non-normality, traditional Cp or Cpk values become obsolete. Instead, performance is quantified using a predictive performance metric, such as a long-term defective rate expressed in parts per million (PPM). This eliminates confusion caused by inconsistent or misleading index values.
Aligning PCI Metrics with Enterprise Goals
A key innovation of the 30,000-foot-level reporting system is its alignment with enterprise-level goals. It transforms abstract metrics like PCI into actionable, enterprise-relevant insights. This is critical for leaders who must justify improvement investments or understand the true impact of a process on customer satisfaction and financial performance.
By visualizing capability data in time-sequenced charts and assessing trends at a high level, the IEE system helps organizations spot not only defects but systemic issues that impact broader business success.
Final Thoughts about Process Capability Index
The process capability index is not inherently flawed—but its traditional use often is. The smarter solution is to embrace a high-level, data-driven methodology that recognizes the complexities of real-world processes. The IEE system’s 30,000-foot-level reporting transforms PCI from a static statistic into a dynamic tool for strategic improvement.
To truly understand and improve your enterprise, don’t just ask, “What’s the Cpk?” Ask instead, “Is the process behavior predictable over time—and is it aligned with what the business needs to succeed?”
Enhancement of KPI and Performance Metrics Reports: 30,000-foot-level reporting
Key Performance Indicator (KPI) and Performance Metrics Reporting benefits when these reports use a 30,000-foot-level format described in “KPI and Performance Metrics Reporting 2.0.”

Process Capability Analysis and the Integrated Enterprise Excellence System
The Integrated Enterprise Excellence (IEE) business management system provides, among other things, 30,000-foot-level metrics that can be in alignment with the processes that create them throughout an organization.
You can create a 30,000-foot-level report for your dataset using a free 30,000-foot-level reporting app.
IEE addresses the business scorecard and improvement issues described in a 1-minute video:

The details of implementing the IEE system and its process capability analysis metrics throughout organizations is described in a 2-book, novel written series:
Books (Audio, Paperback, and E-book) Amazon Availability
- Management 2.0: Discovery of Integrated Enterprise Excellence (Management and Leadership System 2.0 Book 1)
- Leadership System 2.0: Implementing Integrated Enterprise Excellence (Management and Leadership System 2.0 Book 2)
The details of reporting process capability analyses and making their improvement are provided in Lean Six Sigma: A Handbook and Solutions Manual for Green Belt, Black Belt and Master Black Belt Process Improvement Projects 2-book Bundle

Process Capability Analysis Example: Achieving the 3R’s of Business
It should be the goal of every organization to achieve the three Rs of business; i.e., everyone doing the Right things, and doing them Right, at the Right time. One tool that provides direction for the three Rs achievement goal is process performance metrics; i.e., a process performance report-out should lead to the most appropriate action or non-action, which is independent of the person compiling the information.
This basic right-behavior objective is not unlike an inspection gage MSA, which insures that inspectors can adequately determine whether a manufactured component should be accepted or rejected. The PDF’s process capability analysis example shows how this can be achieved.
For more information about the above described process capability analysis example methodology, download the published ASQ Quality Progress January 2010 PDF article titled ″ Insight Or Folly? Resolve Issues with Process Capability Indices, Business Metrics” written by Forrest Breyfogle.
Next Steps
Schedule a video meeting with Forrest to see how your organization could benefit from the IEE system and 30,000-foot-level reporting using one of your datasets.
If you do not see a suitable time in the Schedule a Meeting link below, email Forrest at forrest.breyfogle@smartersolutions.com.