This predictive analytics models example multiple samples in subgroup illustration will demonstrate the value of 30,000-foot-level reporting which is provided in the Integrated Enterprise Excellence (IEE) Business Management System.
This “30,000-foot-level Charting: Multiple Samples in Subgroups” discussion addresses assessing process stability and then potential predictability of these process output response over time.
Predictive Analytics Models Example Multiple Samples in Subgroup: 30,000-foot-level Charting
Content of this webpage is from Chapter 12 of Integrated Enterprise Excellence Volume III – Improvement Project Execution: A Management and Black Belt Guide for Going Beyond Lean Six Sigma and the Balanced Scorecard, Forrest W. Breyfogle III.
Time-series data that have multiple subgroup samples can be monitored over time for stability and then, when a process is stable, provide a prediction statement.
Consider that the data in Table 1 were collected using an infrequent subgrouping/sampling plan, which is consistent with a 30,000-foot-level charting methodology1, and there were specification limits of 95 and 105 for the process’ response.
Traditionally an  and R control chart methodology would be used to track this type of data over time; however, there are issues with this approach as described in X-bar and R Control Chart: Issues and Resolution.
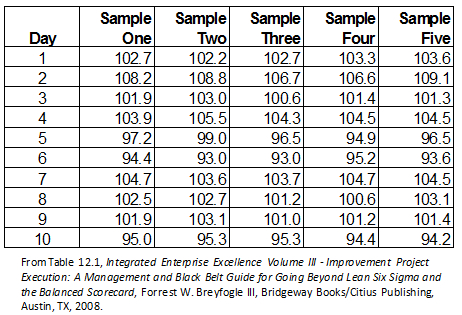
Table 1: Time series Data
These Table 1 data could be the completion time for five randomly-selected daily procedural transactions in an insurance company, hospital, or one-shift manufacturing facility. In the following analyses, focus will be given initially to the assessment of process stability and then, if stable, its process capability relative to customer specifications of 95 to 105.
Figure 1 provides a 30,000-foot-level chart of the response. From the individuals control charts of the mean and log of within subgroup standard deviation shown on the top of the report-out, the process is concluded to have a recent region of stability. This conclusion is made since there are no trends or data points outside the statistically -determined upper and lower control limits (UCL and LCL).
Since the process is considered to have a recent region of stability, it is concluded that the process is predictable. The up-and-down variability shown over time is from common-cause variability. The probability plot at the lower right side of the chart was created from all the raw data during the recent region of stability and provides a process-performance statement relative to the specification limits of 72 and 78. From this plot, a process capability/performance metric estimate of 26.853% non-conformance [(100-81.599) + 8.452 = 26.853] can be made.
Conclusions about this process and its performance relative to predictability and a prediction statement are described at the bottom of the 30,000-foot-level chart in this figure. These statements are written in terms that written in terms that everyone can understand.

Figure 2: 30,000-foot-level Chart2
Reference X-bar and R Control Chart: Issues and Resolution for a more detailed explanation of the methodology summarized in this paper.
Predictive Analytics Models Example Multiple Samples in Subgroup: Summary
The estimated unacceptability rate can be expected in the future unless something changes. To improve a process’ common-cause level of performance when reported at the 30,000-foot-level, the process needs to be enhanced; e.g., through a Lean Six Sigma improvement project.
Predictive Analytics Models Example Multiple Samples in Subgroup: 30,000-foot-level Charting
The described 30,000-foot-level charting technique has many applications, as described in 30,000-foot-level Performance Reporting Applications.
References
- Forrest W. Breyfogle III, Integrated Enterprise Excellence Volume III – Improvement Project Execution: A Management and Black Belt Guide for Going Beyond Lean Six Sigma and the Balanced Scorecard, Bridgeway Books/Citius Publishing, 2008
- Figure created using Enterprise Performance Reporting System (EPRS) Software
For More information see:
Contact Us to set up a time to discuss with Forrest Breyfogle how your organization might gain much from an Integrated Enterprise Excellence (IEE) system to address a potential predictive analytics models example that your organization might be encountering.