
Variance Components Analysis for Destructive Gage R&R is often necessary when a traditional Gage R&R study cannot properly evaluate the measurement system associated with a destructive testing measurement system.
In many manufacturing and chemical-process environments, the act of measuring changes or destroys the sample itself. In these situations, the exact same part or sample cannot be repeatedly measured by multiple appraisers in the conventional crossed Gage R&R format.
Because viscosity sampling in this study required oversized subsamples that changed the original sample condition during testing, a nested variance components analysis approach was required instead. This methodology enables organizations to separate and quantify variation from batches, within-batch sampling locations, appraisers, and repeatability effects while still obtaining meaningful insight into the true sources of process variation. This type of Measurement System Analysis (MSA) is especially important for organizations pursuing enterprise performance improvement through Lean Six Sigma analytics and predictive KPI management.
Example (Part A): Process Output Metric Report
The viscosity response from a batch process had a specification of 1350-1650 centipoise. A 30,000-foot-level report indicated, using a free app, that about 18% of the batches were unsatisfactory.
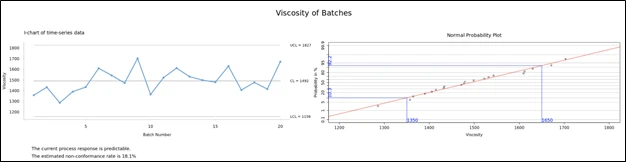
There is a need for process improvement since management considered that the magnitude of this non-conformance rate (i.e., 18.1 % from the bottom of the 30,000-foot-level report) was considered too large.
The initial 30,000-foot-level report identified that approximately 18% of viscosity batches exceeded customer specification requirements, indicating the need for deeper investigation into the underlying drivers of process-output variability, common cause variation, and measurement system variability. However, before launching process-improvement activities, it was essential to determine how much of the observed variation originated from the process itself versus the measurement system. Since this viscosity evaluation involved destructive testing conditions, a variance components analysis methodology was selected instead of a traditional crossed Gage R&R study.
Example (Part B): Variance Components Analysis of Batch-to-Batch Variation
A couple items that a process-improvement team thought could impact viscosity were variability between batches, variability within batches, and the measurement system for determining viscosity, i.e., the need for a gage R&R study. A variance components study and Nested Gage R&R study methodology will be used to address the viscosity measurement system since a traditional Gage R&R study is not appropriate for this situation.
The following variance components analysis study assesses the impact of these variables to gain insight into the process gain for identifying targeted improvement efforts. In this experiment, samples within a batch were taken near the top, middle and bottom. To conduct the measurement repeatability and reproducibility aspect of this experiment, each sample taken was four times larger than a normal sample. Each of these four subsamples will be considered identical for the purpose of the viscosity variance components destructive test analysis.

The output from a Minitab variance components analysis and Statistical Process Control evaluation is:
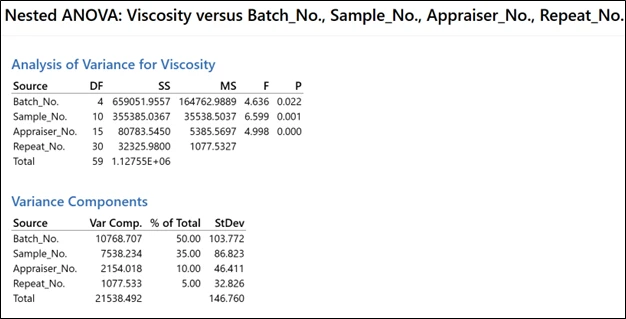
This analysis shows a significant difference between appraisers, which addresses about 10% of the response’s total variability, while Appraiser repeatability is about 5%. The perhaps surprising result is that samples within a batch are significant, with an estimated 35% of the total variance. One conclusion from this experiment is that there is a need to investigate what should be done differently to address measurement inconsistencies within a batch.
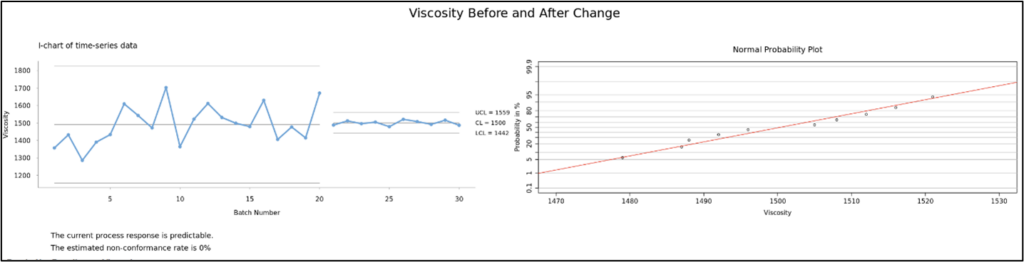
A team made changes to the mixing process so that viscosity was more consistent within each batch. Also, changes were made so that inspectors were more consistent in their inspection process. These actions resulted in substantial reductions in process variation and improvements in process capability.
The following 30,000-foot-level report shows a large improvement in response after the implementation of these changes.
Example (Part C): Statistical Analyses Comparing Before and After Staging
A statistical test of the equality of the mean before and after staging showed no significance at a level of 0.05.
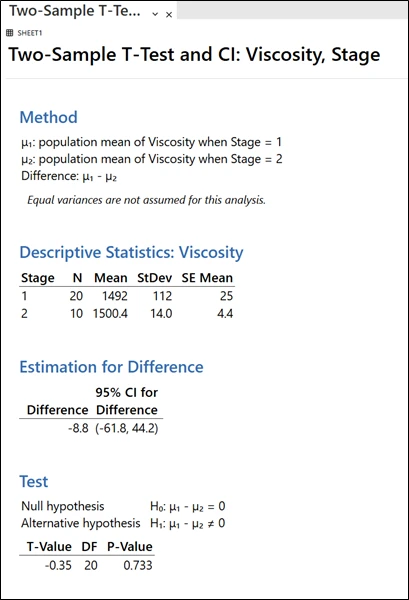
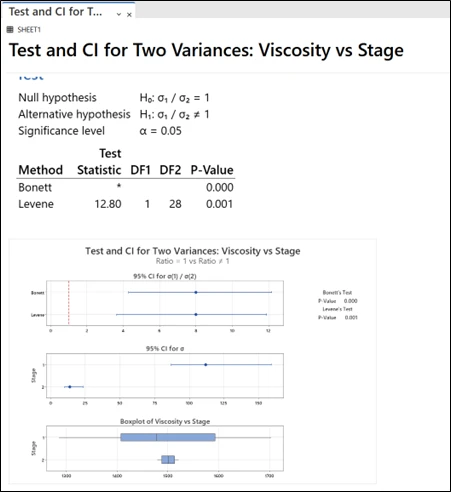
A statistical analysis of the equality of variance before and after staging showed a significant difference.
Conclusion: Nested Gage R&R Study and Measurement System Analysis
This variance components analysis for destructive Gage R&R demonstrated how organizations can move beyond traditional measurement-system-analysis methods to gain deeper insight into true process behavior. The study revealed that a substantial portion of total viscosity variation originated from within-batch inconsistency and appraiser differences rather than solely from batch-to-batch variation.
By using predictive 30,000-foot-level metrics together with variance components analysis, the organization identified targeted improvement opportunities that significantly reduced process variability while maintaining the desired process average. The resulting improvement reduced the estimated nonconformance rate from approximately 18% to roughly 0%, illustrating how measurement-system understanding and process-focused corrective actions can dramatically improve operational performance.
This example also highlights an important Management 2.0 principle: organizations should focus not only on averages, but also on understanding and reducing variation throughout the enterprise. When companies combine predictive performance metrics, measurement-system insight, and statistically sound improvement methods, they can achieve far more stable and financially predictable business results. This Operational Excellence 2.0 approach illustrates how organizations can combine predictive performance metrics, advanced Measurement System Analysis (MSA), and statistical thinking to drive sustainable enterprise performance improvement.
Suggested Reading
If the “smarter approach” described in this article appeals to you, I suggest that you check out:
- Predictive Performance Metrics | Achieve Clarity, Stability & Better Executive Decisions
- Operational Excellence 2.0 for Executive Leaders: How to Deliver Predictable Financial Results in an Uncertain Economy
- Business Management System 2.0 for executive leaders replaces dashboard confusion with predictive performance, governance cadence, and earnings stability.
- Enterprise Performance Management Framework: A Better Way to Create Predictability, Accountability, and Sustainable Financial Success
- Key Performance Indicators Reporting 2.0
Next Steps
Organizations often underestimate how much operational instability originates from poorly understood process variation and measurement-system limitations. If you would like to discuss how predictive 30,000-foot-level metrics, variance components analysis, and Integrated Enterprise Excellence (IEE) methods can improve organizational performance, schedule an executive discussion session.
You can schedule a video meeting session with me through the link https://smartersolutions.com/schedule-zoom-session/