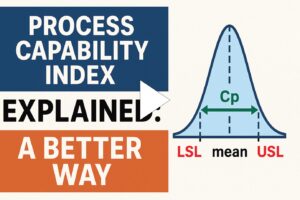
This process capability index explained posting addresses the indices Cp, Cpk, Pp, and Ppk. An enhanced reporting methodology is also described that provides many benefits over a traditional approach.
Process Capability Index Explained Webinar: Topics
When a specification exists
- Cp/Cpk/Pp/Ppk
- Sigma Level and DPMO (defect per million opportunities)
- Z-score
- Percent non-conforming or Yield loss
When no specification exists, noting that this is a situation that cannot be addressed using a traditional process capability index calculation approach.
Webinar: Process Capability Index Explained – A Better Way
Explanation: An Enhanced Approach to Process Capability Index Reporting
As the webinar describes, there are fundamental issues with traditional process capability reporting. For more elaboration about process capability index calculation and its enhancements see Resolving Process Capability Index Issues For Cp, Cpk, Pp, Ppk.
The Integrated Enterprise Excellence (IEE) business management system 30,000-foot-level performance metric reporting approach has many advantages over traditional process capability index reporting, as noted in the webinar.
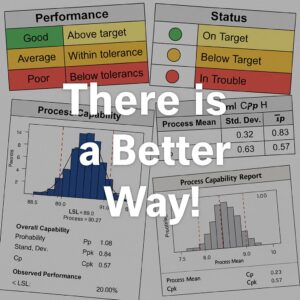
An example 30,000-foot-level report-out, when specification criteria exists is:

In the above 30,000-foot-level report-out, an individuals chart indicates process stability, while the probability plot on the right is used to determine a percentage beyond the specification limits of 72-78. This percentage beyond the specification limits value is then reported as a capability statement at the bottom of the report-out.
This easy-to-understand language for process capability reporting is also a predictive statement, since the individuals chart is stable. Note, if a futuristic statement is not desirable, something needs to be done differently to improve the process.
An example 30,000-foot-level report-out can also provide a “process capability” (i.e., how the process is basically performing) statement, when no specification criteria exists.
An example of this report-out is:

The probability plot now (because there is no specification) uses the 90, 50, and 10 percentage points to provide a process capability statement (i.e., a high-level overview of how the process is performing) shown at the bottom of the report-out.
You can create a 30,000-foot-level report for your dataset using a free 30,000-foot-level reporting app.
How to Calculate Process Capability Index: Understanding the Steps for Meaningful Insight
When striving to assess whether a process can consistently produce output within specification limits, many professionals turn to a key statistical measure: the process capability index (commonly denoted as Cp, Cpk, Pp, and Ppk). However, while the formulas themselves are relatively simple, the correct application of these indices requires more than just plugging numbers into an equation. To calculate process capability index in a way that yields true insight into performance, one must consider not only the data but also the context.
Understanding the Basics of Process Capability
The process capability index quantifies how well a process can meet specification limits. In its simplest form, the Cp index is calculated using the formula:
Where:
-
USL = Upper Specification Limit
-
LSL = Lower Specification Limit
-
σ (sigma) = estimated standard deviation of the process
This calculation assumes that the process is centered within the specification limits. However, most real-world processes exhibit some degree of shift from the target. That’s where Cpk becomes a more reliable measure:
Cpk = min [ (USL – μ) / (3σ), (μ – LSL) / (3σ) ]
Here, μ represents the process mean. Cpk takes into account both the spread and the centering of the process.
Getting to an Accurate Calculation
Before jumping into calculations, it’s critical to ensure:
-
The data is stable and representative of current operations.
-
There are no special causes of variation influencing the dataset.
-
The process is ideally in statistical control.
Using control charts, such as X-bar and R charts, to verify process stability prior to computing indices avoids drawing misleading conclusions from short-term or non-representative data.
Once stability is confirmed:
-
Collect a sufficient sample of continuous data.
-
Calculate the process mean (μ) and standard deviation (σ).
-
Plug these values into the Cp and Cpk formulas to determine the indices.
Why Just Calculating Isn’t Enough
While the formulas to calculate process capability index may seem straightforward, simply reporting a Cpk value of 1.33 or greater is not sufficient for decision-making. Without understanding the underlying context, these values can lead to a false sense of process adequacy.
For instance:
-
A high Cpk with wide tolerance limits might hide poor process consistency.
-
A low Cpk may not indicate an issue if the tolerance limits are unnecessarily tight.
Moreover, long-term capability (Pp, Ppk) and short-term capability (Cp, Cpk) measure different perspectives. Misapplying these indices leads to flawed interpretations.
A Smarter Approach to Capability Index Use
Smarter Solutions promotes an enterprise-level approach to capability assessment, where indices are not just calculated but contextualized within broader process goals. By embedding capability indices into a business-wide improvement system like Integrated Enterprise Excellence (IEE), organizations move beyond metrics to actionable insight.
In summary, to truly calculate process capability index effectively, it’s not just about equations—it’s about aligning analysis with strategy. Learn more at SmarterSolutions.com about how enhanced capability reporting can guide better decisions.
Cpk Process Capability Index: A Deeper Look into Performance Alignment
When evaluating whether a process is capable of meeting customer requirements, the Cpk process capability index is often the go-to metric. Unlike its simpler counterpart, Cp, the Cpk index provides more than just a view of process spread—it also evaluates whether the process is centered between the specification limits. This distinction is critical for organizations seeking to move beyond surface-level quality metrics toward performance measures that drive real business insight.
What Does Cpk Really Tell You?
The Cpk index measures the distance between the process mean (μ) and the nearest specification limit, scaled by the process variation (σ). The formula is:
Cpk = min [ (USL – μ) / (3σ), (μ – LSL) / (3σ) ]
This equation highlights two vital points:
-
If the process is centered, Cpk ≈ Cp.
-
If the process is off-center, Cpk < Cp, revealing that the process is skewed toward one of the limits.
A high Cpk value (typically ≥ 1.33) indicates that the process not only has a small variation but is also well-centered between the specification limits. In contrast, a low Cpk may suggest either excessive variability or a shift in the mean—both of which can increase the likelihood of producing defects.
The Danger of Relying on Cpk Alone
Despite its usefulness, Cpk should not be interpreted in isolation. Many organizations mistakenly assume that a high Cpk means the process is performing optimally. However, a few hidden traps exist:
-
Cpk is a short-term capability metric. It reflects only current performance and assumes a stable process. It does not account for long-term drifts or systemic shifts in behavior.
-
A high Cpk can mislead when the process is unstable. If the underlying process has special cause variation, Cpk may present a false sense of confidence.
-
It doesn’t reflect business impact. A high Cpk might be achieved through overly wide specifications that have little to do with customer expectations or profitability.
Smarter Use of the Cpk Process Capability Index
At Smarter Solutions, we emphasize that the Cpk process capability index must be interpreted within the context of a stable and strategic process. Before calculating Cpk, organizations should:
-
Use control charts to ensure the process is in statistical control.
-
Understand how variation affects downstream systems and customers.
-
Integrate Cpk results into a broader business framework such as the Integrated Enterprise Excellence (IEE) system.
By embedding Cpk calculations into an enterprise-wide improvement methodology, organizations gain more than a snapshot—they achieve a real-time feedback loop that links quality performance with strategic goals.
Final Thought
The Cpk process capability index remains a cornerstone of statistical process control, but its real power lies in how it is used—not just how it is calculated. A smarter approach combines Cpk insights with predictive analysis, business alignment, and continuous improvement. That’s where Smarter Solutions offers a better way.
Process Capability Index Calculation: Going Beyond the Numbers
Calculating a process capability index might seem like a straightforward statistical exercise, but when done properly, it can unlock deep insights into the true performance and potential of a process. The most common indices—Cp, Cpk, Pp, and Ppk—each provide different perspectives, but all start with one foundational activity: understanding the variability in your process.
What Is a Process Capability Index?
A process capability index quantifies how well a process can produce output within specified limits. These limits, known as the Upper Specification Limit (USL) and Lower Specification Limit (LSL), define the acceptable range for a critical-to-quality characteristic. The index compares these specification limits to the natural variation (spread) of the process, usually represented by the standard deviation (σ).
The basic Cp formula is:
This gives a measure of potential capability, assuming the process is perfectly centered. But real-world processes are rarely so ideal, which is why Cpk is more commonly used:
Cpk = min [ (USL – μ) / (3σ), (μ – LSL) / (3σ) ]
This version accounts for process centering, measuring how close the process mean (μ) is to either specification limit.
Steps for Process Capability Index Calculation
To ensure your calculation is accurate and meaningful, follow these steps:
-
Verify Process Stability: Use control charts to confirm that the process is in statistical control. Without stability, any capability index can be misleading.
-
Collect Continuous Data: Gather a sufficient sample of measurements for the characteristic you’re evaluating. The more representative your data, the more reliable your results.
-
Calculate Mean and Standard Deviation: Determine the average (μ) and standard deviation (σ) of the dataset.
-
Apply the Formulas: Use the Cp and Cpk formulas to compute the capability indices. If evaluating long-term data, use Pp and Ppk instead, which use the total standard deviation without assuming control.
Why Context Matters
Many organizations make the mistake of treating process capability index calculations as final answers. In truth, these numbers are only as valuable as the context in which they are applied. A high Cpk value does not guarantee high quality—especially if the specification limits are unreasonably wide or if the process is unstable over time.
Likewise, calculating indices on short-term data or without verifying control status can lead to poor decisions. This is why Smarter Solutions promotes a more integrated and insightful approach through the Integrated Enterprise Excellence (IEE) system.
Smarter Capability Evaluation
With IEE, capability index calculations are not isolated statistics—they become part of a systematic method for identifying high-impact improvements that are aligned with business goals. This approach reduces firefighting and enhances decision-making across the enterprise.
So, while process capability index calculation is a powerful tool, its true value comes when it’s used as part of a broader business improvement framework. Don’t just calculate—contextualize.
Process Capability Index Calculator: What It Is—and What It’s Not
In today’s data-driven environment, many quality professionals and process engineers look for quick tools to assess process performance. A process capability index calculator has become one of the most commonly used shortcuts for evaluating how well a process conforms to its specification limits. These tools are widely available online and often embedded within statistical software programs. But while a calculator can produce numbers quickly, interpreting those numbers meaningfully is where the real value lies.
What Does a Process Capability Index Calculator Do?
A process capability index calculator typically automates the calculation of key performance metrics, including Cp, Cpk, Pp, and Ppk. These indices are used to assess how well a process is performing relative to its specified tolerance range.
For example, the formulas often used in these calculators are:
-
Cp = (USL – LSL) / 6σ
-
Cpk = min[(USL – μ) / 3σ, (μ – LSL) / 3σ]
Where:
-
USL/LSL = Upper and Lower Specification Limits
-
μ = Process mean
-
σ = Process standard deviation
These metrics can be calculated in seconds by simply entering values into the tool. However, the simplicity of the process belies the complexity of proper usage.
The Limitation of Simple Calculators
Relying solely on a capability calculator to judge process performance is like using a thermometer to evaluate overall health. It gives one data point, but not the whole picture. These tools do not assess whether:
-
The process is stable (i.e., in statistical control)
-
The data is normally distributed
-
The short-term vs. long-term variability is being correctly considered
Many users mistakenly interpret a high Cpk value as a sign that a process is healthy, when in reality the process could be unstable or the specification limits unreasonably wide.
Context Is Critical
Before using a calculator, it is essential to understand what type of data is being analyzed. Is it from a controlled environment or subject to external variables? Is it recent or historical? Does it reflect true process behavior or a temporary condition?
Moreover, the distinction between Cp/Cpk (short-term capability) and Pp/Ppk (long-term performance) is often overlooked in quick calculations. These metrics serve different purposes and should not be used interchangeably.
A Better Approach: Capability Within a Business Framework
At Smarter Solutions, we advocate for a more comprehensive methodology. In our Integrated Enterprise Excellence (IEE) system, capability indices are just one piece of the puzzle. We use these tools within a larger framework that considers process stability, business impact, and the alignment of operational performance with strategic objectives.
Rather than relying on a standalone process capability index calculator, we help organizations embed capability assessment into a structured improvement system that leads to lasting results.
Process Capability Index Calculator Conclusion
Yes, a process capability index calculator is useful—but only if you understand its limits. The most powerful insights come not from automation alone, but from thoughtful analysis, contextual awareness, and strategic application. With the right system in place, these numbers can help drive smarter decisions and enterprise-wide success.
Enhancement of KPI and Performance Metrics Reports: 30,000-foot-level reporting
Key Performance Indicator (KPI) and Performance Metrics Reporting benefits when these reports use a 30,000-foot-level format described in “KPI and Performance Metrics Reporting 2.0.”

An Enhanced Approach for Scorecards in an Overall Business Management System
A 30,000-foot-level approach for tracking metrics can be used throughout an organization via the IEE enhanced business management system methodology.
You can create a 30,000-foot-level report for your dataset using a free 30,000-foot-level reporting app.
An IEE system addresses the business scorecard and improvement issues described in a 1-minute video:

Books for Process Capability Reporting and Much More
All Smarter Solutions Lean Six Sigma training includes and references our books, which attendees can reference and use long after training.

-
-
-
-
-
-
- Management 2.0: Discovery of Integrated Enterprise Excellence (Management and Leadership System 2.0 Book 1) Novel written book (Part 1) that is available in audio book format
- Leadership System 2.0: Implementing Integrated Enterprise Excellence (Management and Leadership System 2.0 Book 2) Novel written book (Part 2) that is available in audio book format
- Minitab® and Lean Six Sigma: A Guide to Improve Business Performance Metrics
- SigmaXL® and Lean Six Sigma: A Guide to Improve Business Performance Metrics
- Integrated Enterprise Excellence, Vol. II Business Deployment: A Leaders’ Guide for Going Beyond Lean Six Sigma and the Balanced Scorecard
- Integrated Enterprise Excellence, Vol. III Improvement Project Execution: A Management and Black Belt Guide for Going Beyond Lean Six Sigma and the Balanced Scorecard
- Lean Six Sigma Project Execution Guide: The Integrated Enterprise Excellence (IEE) Process Improvement Project Roadmap
- Lean Six Sigma: A Handbook and Solutions Manual for Green Belt, Black Belt and Master Black Belt Process Improvement Projects 2-book Bundle
-
-
-
-
-
Next Steps
Schedule a video meeting with Forrest to see how your organization could benefit from the IEE system and 30,000-foot-level reporting using one of your datasets.
If you do not see a suitable time in the Schedule a Meeting link below, email Forrest at forrest.breyfogle@smartersolutions.com.