Enhanced process capability analysis reporting is available through the Integrated Enterprise Excellence (IEE) Business Management System 30,000-foot-level report-outs.
Enhanced Process Capability Analysis Reporting: Description
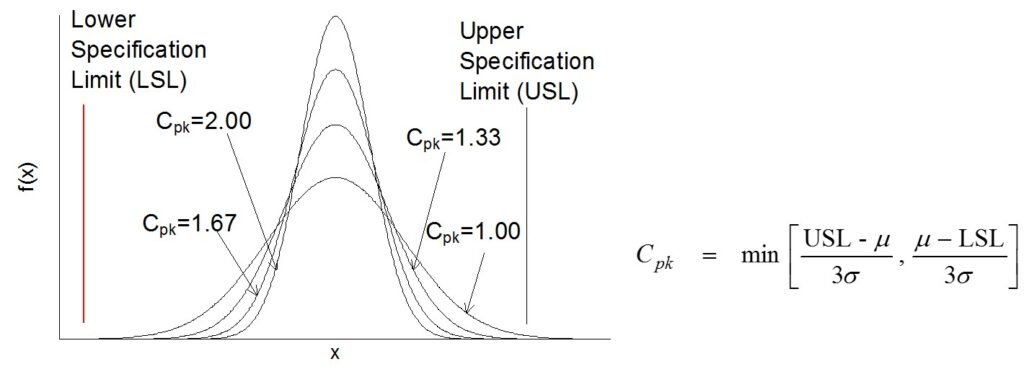
Process capability analysis statements are to describe how a stable process is performing relative to customer specification needs. The equation for traditional process capability analysis indices reporting is not difficult, as noted in the Cpk calculation below.
However, the standard used in the calculation is very dependent upon where the data originates, as noted below.

The results reported in a traditional process capability report out is very dependent how data are gathered from a process. Also, the understanding of the reported Cp, Cpk, Pp, and Ppk is confusing.
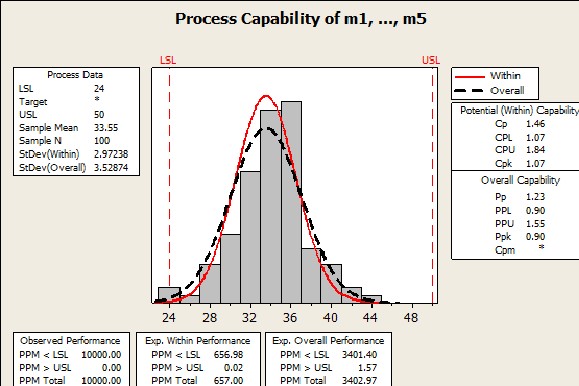
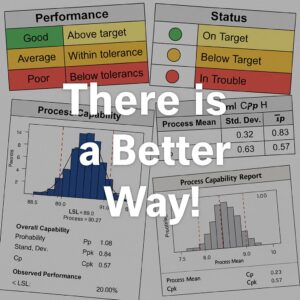
An IEE 30,000-foot-level metric report-out addresses these issues, where process stability is assessed in an individuals chart(s) (left chart in example presentation figure below) and the process capability is determine from a high-level perspective (probability plot in below example output figure). A statement is also reported in a 30,000-foot-level report-out (bottom of output) that can be easily understood.

You can create a 30,000-foot-level report for your dataset using a free 30,000-foot-level reporting app.
The webinar below elaborates more on the details of providing process capability analysis from a 30,000-foot-level perspective.
Enhanced Process Capability Reporting: Webinar
For a given process, do you think everyone would create a similar looking control chart and make a comparable statement relative to its control and capability? Not necessarily.
Process statements are not only a function of procedural characteristics and sampling chance differences but can also be very dependent upon sampling approach. The implication of this is that one person could describe a process as being out of control, which would lead to activities that immediately address process perturbations as abnormalities, while another person could describe the process as being in control.
For this second interpretation, the perturbations are perceived as fluctuations typically expected within the process, where any long-lasting improvement effort involves looking at the whole process. During this session, issues with traditional control charting techniques (e.g., x-bar and R charts) and process capability indices statements (e.g., Cp, Cpk, Pp, and Ppk) will be discussed.
An enhanced alternative predictive performance measurement system will then be described that not only provides resolution to these issues but can also provide a predictive statement, which everyone can understand.

Enhancing Insight with Process Capability and the Process Capability Index
Organizations across industries strive to ensure their processes consistently meet customer expectations. However, achieving this goal requires more than just occasional monitoring or reactive fixes. A key element in understanding and improving process performance lies in the application of process capability analysis and its associated indices.
What is Process Capability?
Process capability is a statistical measure that evaluates how well a process can produce output within specified limits, typically defined by customer requirements or engineering tolerances. Unlike simple quality control checks, process capability provides a proactive insight into how likely it is that future product outputs will meet specification limits, assuming the process remains stable.
The analysis typically involves calculating the spread and central tendency of a process distribution relative to the specification limits. When visualized through a histogram or process behavior chart, capability assessments help determine whether the existing process is adequate or requires improvement.
Introducing the Process Capability Index (Cpk)
The Process Capability Index, or Cpk, quantifies how close a process is running to its specification limits relative to its natural variability. The higher the Cpk, the more capable a process is. A Cpk value of 1.0 indicates the process is producing output that meets specifications 99.73% of the time (assuming a normal distribution), while higher values (e.g., 1.33 or 1.67) suggest better performance and less likelihood of defect.
It’s important to distinguish between Cp and Cpk:
- Cp measures process potential assuming the process is centered between the specification limits.
- Cpk accounts for actual process centering, providing a more realistic picture of capability.
Common Pitfalls with Process Capability Analysis
Despite the widespread use of Cpk and Cp, many organizations encounter challenges that lead to misleading or non-actionable results:
- Non-normal data distributions: Traditional indices assume normality, which may not hold in practice.
- Inappropriate subgrouping: Improper selection of subgroup size or sampling intervals can distort capability insights.
- Unstable processes: Applying capability analysis to processes that are not in statistical control leads to invalid results.
A Smarter Approach to Capability Evaluation
The Integrated Enterprise Excellence (IEE) methodology advocated by Smarter Solutions addresses these issues by embedding process capability analysis into a broader context of enterprise-wide improvement. Rather than viewing Cpk in isolation, IEE links capability metrics directly to business goals and predictive analytics. This structured approach ensures that capability assessments translate into targeted improvements that yield measurable results.
For example, control charting within IEE focuses not only on identifying special cause variation but also on ensuring that the system’s stability and predictability are validated before any capability statement is made. Moreover, IEE emphasizes graphical methods and diagnostics that help validate assumptions about data distribution and process behavior before applying conventional capability indices.
Process Capability and the Process Capability Index Conclusions
Effective use of process capability and the process capability index allows businesses to understand whether their processes are capable of consistently meeting specifications. However, the true value lies in applying these tools within a structured methodology like IEE that ensures their accurate interpretation and integration into enterprise-wide improvement efforts. This smarter approach leads to better decisions, fewer surprises, and ultimately, greater customer satisfaction and business success.
Enhancing Process Capability Analysis: A Deeper Dive into the Capability Process Index
In the realm of quality management, understanding and effectively utilizing the Capability Process Index is paramount, eventhough the IEE system reporting methodology is better.
This statistical measure is supposed to provide insight into a process’s ability to produce outputs within specified limits, ensuring consistency and quality in production.
Understanding the Core Indices: Cp and Cpk
At the heart of process capability analysis lie two critical indices: Cp and Cpk.
- Cp (Process Capability Index): This index assesses the potential capability of a process by comparing the width of the process spread (i.e., six standard deviations) to the width of the specification limits. The formula is:
Cp = (USL – LSL) / (6 * σ)
Where USL and LSL are the upper and lower specification limits, respectively, and σ represents the standard deviation. A higher Cp indicates a process with less variability relative to the specification limits.
- Cpk (Process Capability Index considering centering): While Cp assumes the process is centered between the specification limits, Cpk accounts for any shift in the process mean. It is calculated as:
Cpk = min[(USL – μ) / (3 * σ), (μ – LSL) / (3 * σ)
Here, μ denotes the process mean. Cpk provides a more realistic measure of process capability by considering both the process variability and its alignment with the target.
Interpreting the Indices
The values of Cp and Cpk offer insights into process performance:
- Cp = Cpk: The process is centered and within specification limits.
- Cp > Cpk: The process is capable but not centered, indicating potential for improvement.
- Cp < 1 or Cpk < 1: The process is not capable, producing outputs outside specification limits.
A Cpk value of 1.33 or higher is generally considered acceptable, indicating that the process produces outputs well within specification limits. A Cpk of 2.0 or higher signifies a highly capable process, often associated with Six Sigma quality levels.
Practical Application and Continuous Improvement
Implementing these indices in real-world scenarios involves:
- Data Collection: Gathering accurate and sufficient data on process performance.
- Statistical Analysis: Calculating Cp and Cpk to assess process capability.
- Process Evaluation: Identifying areas where the process may be off-center or exhibit excessive variability.
- Continuous Improvement: Implementing corrective actions to center the process and reduce variability, thereby enhancing capability.
By regularly monitoring these indices, organizations can proactively address process issues, leading to improved quality, reduced waste, and increased customer satisfaction.
Capability Process Index Conclusions
The Capability Process Index is a tool in quality management. This tool is supposed offering a quantitative measure of a process’s ability to meet specifications. It is said that by understanding and applying Cp and Cpk, organizations can identify areas for improvement, ensure consistent product quality, and achieve operational excellence. However, capability process index reports are difficult to understand by practitioners and management.
The previously described approach for this capability process index reporting, even when a specification does not exist is available through IEE 30,000-foot-level reports
Understanding the Cpk Index in Process Capability Analysis
In the realm of quality management, the Cpk index stands as a metric for assessing how well a process can produce outputs within specified limits. Building upon the foundational concepts of control charting and process capability statements, as discussed in our previous blog, this article delves deeper into the nuances of the Cpk index and its significance in process capability analysis.
Defining the Cpk Index
The Cpk (Process Capability Index) measures a process’s ability to produce outputs within the upper and lower specification limits, considering both the process mean and variability. It provides insight into how centered the process is and how much natural variation exists.
The formula for calculating Cpk is:
Cpk = min[(USL – μ) / (3σ), (μ – LSL) / (3σ)]
Where:
USL = Upper Specification Limit
LSL = Lower Specification Limit
μ = Process Mean
σ = Standard Deviation
This calculation determines the closest distance between the process mean and the specification limits, scaled by the process’s standard deviation.
Interpreting Cpk Values
Understanding the Cpk value is crucial for evaluating process performance:
Cpk < 1.00: The process is not capable; outputs frequently fall outside specification limits.
Cpk = 1.00: The process is marginally capable; approximately 99.73% of outputs are within limits.
Cpk ≥ 1.33: The process is considered capable; a common industry benchmark.
Cpk ≥ 1.67: The process is highly capable; often required for critical applications.
Cpk ≥ 2.00: The process exhibits excellent capability; aligns with Six Sigma standards.
These benchmarks help organizations determine the adequacy of their processes and identify areas needing improvement.
Cpk vs. Cp: Understanding the Difference
While both Cp and Cpk assess process capability, they serve different purposes:
Cp measures the potential capability of a process, assuming it is perfectly centered between specification limits.
Cpk accounts for both the process variability and its deviation from the center of the specification limits.Lean Management Consultancy+1SixSigma.us+1
A significant difference between Cp and Cpk values indicates that the process mean is not centered, highlighting the need for process adjustments.
Practical Application of Cpk in Quality Improvement
Implementing Cpk analysis involves several steps:
Data Collection: Gather process data to calculate the mean and standard deviation.
Cpk Calculation: Apply the Cpk formula to assess process capability.
Benchmark Comparison: Compare the Cpk value against industry standards or internal benchmarks.
Process Adjustment: If the Cpk is below desired levels, investigate and address sources of variation or process centering issues.Cuemath
Regular monitoring of Cpk values enables organizations to maintain high-quality standards and drive continuous improvement.
Cpk Index Conclusion
The Cpk index is a traditional tool in process capability analysis. This index is to offer a quantitative measure of how well a process meets specification limits. It is said, by understanding and applying Cpk, organizations can identify process inefficiencies, implement targeted improvements, and achieve higher quality outcomes. However, IEE 30,000-foot-level provide a better and more easily to understand methodology that typically leads to much better behaviors.
Demystifying the Process Capability Index Formula: Precision Through Measurement
To ensure long-term success and competitiveness, organizations must produce products and services that consistently meet customer requirements. A key metric that is to quantify this consistency is the process capability index, which measures how well a process performs relative to its specification limits. Understanding the process capability index formula is essential for making meaningful improvements.
What Is the Process Capability Index?
The process capability index, commonly expressed through terms like Cp, Cpk, Pp, and Ppk, allows businesses to assess the alignment between the output of a process and the desired specifications. These indices help evaluate whether the inherent variability of a process is acceptable.
The Process Capability Index Formula Explained
Let’s start with the most widely used formulas for Cp and Cpk, which are typically calculated for processes that are in statistical control.
- Cp (Process Capability):
Cp = (USL – LSL) / (6 * σ)
- USL: Upper Specification Limit
- LSL: Lower Specification Limit
- σ: Standard deviation of the process
Cp measures the potential capability of a process assuming it is centered between the specification limits. However, it does not consider the actual position of the process mean.
- Cpk (Process Capability Index, accounting for centering):
Cpk = min[ (USL – μ) / (3 * σ), (μ – LSL) / (3 * σ) ]
- μ: Mean of the process
Cpk incorporates both the variability and the centering of the process. This gives a more realistic indication of the process’s ability to meet specifications under real conditions.
Why the Formula Matters
Using the correct process capability index formula ensures that performance assessments are data-driven and accurate. A high Cp but low Cpk signals a well-controlled process that is off-center — an issue that could lead to defects even if variability is low.
By contrast, a high Cpk implies that the process is not only capable but also properly aligned with customer expectations. Regularly calculating and reviewing these indices helps organizations:
Detect shifts in process behavior
Uncover hidden inefficiencies
Prioritize improvement efforts
Communicate capability to customers and stakeholders
Going Beyond Cp and Cpk: Pp and Ppk
For short-term studies or when the process is not in control, Pp and Ppk are used:
Here, s represents the overall standard deviation (not just within subgroups), and x̄ is the average across all data.
Process Capability Index Formula Final Thoughts
The process capability index formula is more than just a statistical expression — it’s a window into how well your operations align with quality goals. Properly understanding and applying these formulas allows for a proactive quality strategy, rather than reactive troubleshooting. For those implementing advanced systems like Smarter Solutions’ Integrated Enterprise Excellence (IEE), these metrics form a solid foundation for actionable performance analysis.
Enhancement of KPI and Performance Metrics Reports: 30,000-foot-level reporting
Key Performance Indicator (KPI) and Performance Metrics Reporting benefits when these reports use a 30,000-foot-level format described in “KPI and Performance Metrics Reporting 2.0.”

Enhanced Process Capability Reporting: Free 30,000-foot-level Reporting App and Integrated Enterprise Excellence (IEE)
You can create a 30,000-foot-level report for your dataset using a free 30,000-foot-level reporting app.
IEE addresses the business scorecard and improvement issues that are described in a 1-minute video:

How to select improvement projects so that the “big picture” benefits is described in How to Identify and Select Lean Six Sigma Projects: An Enhanced Approach.
IEE is described in:
- Article: Positive Metric Performance, Poor Business Performance – How Does this Happen?
- Video: Positive Metric Performance, Poor Business Performance – How Does this Happen?

The details of implementing the IEE system and its process capability analysis throughout organizations is described in a 2-book, novel written (audio-book available) and a 5-book series:

Integrated Enterprise Excellence (IEE) Business Management System 30,000-foot-level metrics can be automatically updated and be provided through an IEE value chain through Enterprise Performance Reporting System (EPRS) software.
Next Steps
Schedule a video meeting with Forrest to see how your organization could benefit from the IEE system and 30,000-foot-level reporting using one of your datasets.
If you do not see a suitable time in the Schedule a Meeting link below, email Forrest at [email protected].